
Bitcoin has continued its corrective move this week, dropping from all-time highs and testing key trendline and support levels. While the broader macro structure remains bullish, the short-term outlook suggests consolidation or even deeper downside if buyer momentum fails to step in soon.
Technical Analysis
By Shayan
The Daily Chart
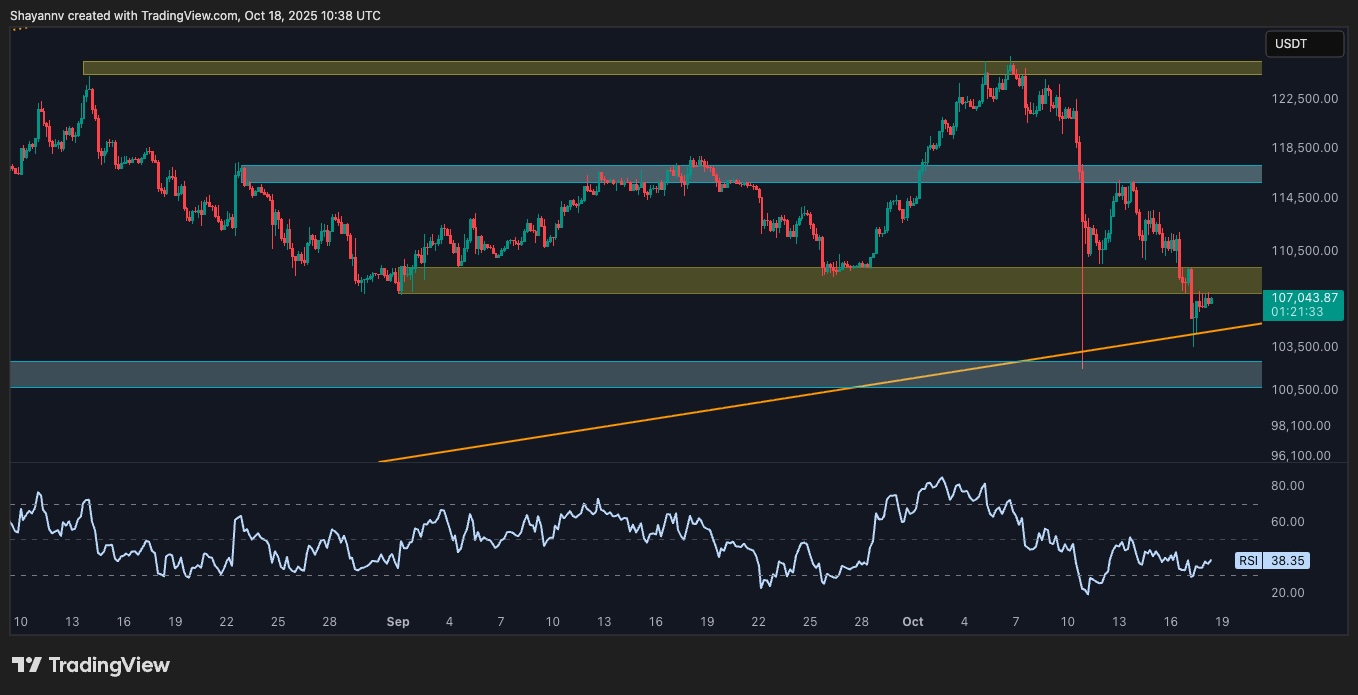
On the daily timeframe, BTC has broken below the 100-day moving average, located around $115K, but is currently sitting right on the lower trendline of the large ascending channel and the critical 200-day moving average. This area also aligns with a previous order block and is acting as major support.
However, RSI remains under 40, reflecting a clear loss of bullish momentum, and unless the price rebounds quickly, this trendline could break, opening the door toward levels below the key $100K zone, which could lead to an overall bearish shift in market trend.
The 4-Hour Chart
Zooming in, it is evident that BTC has formed a minor base around $105K after the breakdown of $115K and $109K levels. The asset is struggling to reclaim the $108K-$109K zone that has now turned into resistance. Moreover, the RSI is slightly bouncing but still lacks strong momentum, hovering around 38.
The overall structure still favors the bears in the short term unless a strong reclaim of $110K followed by higher lows materializes. Otherwise, sellers could push BTC into the $100K region or even lower.
Sentiment Analysis
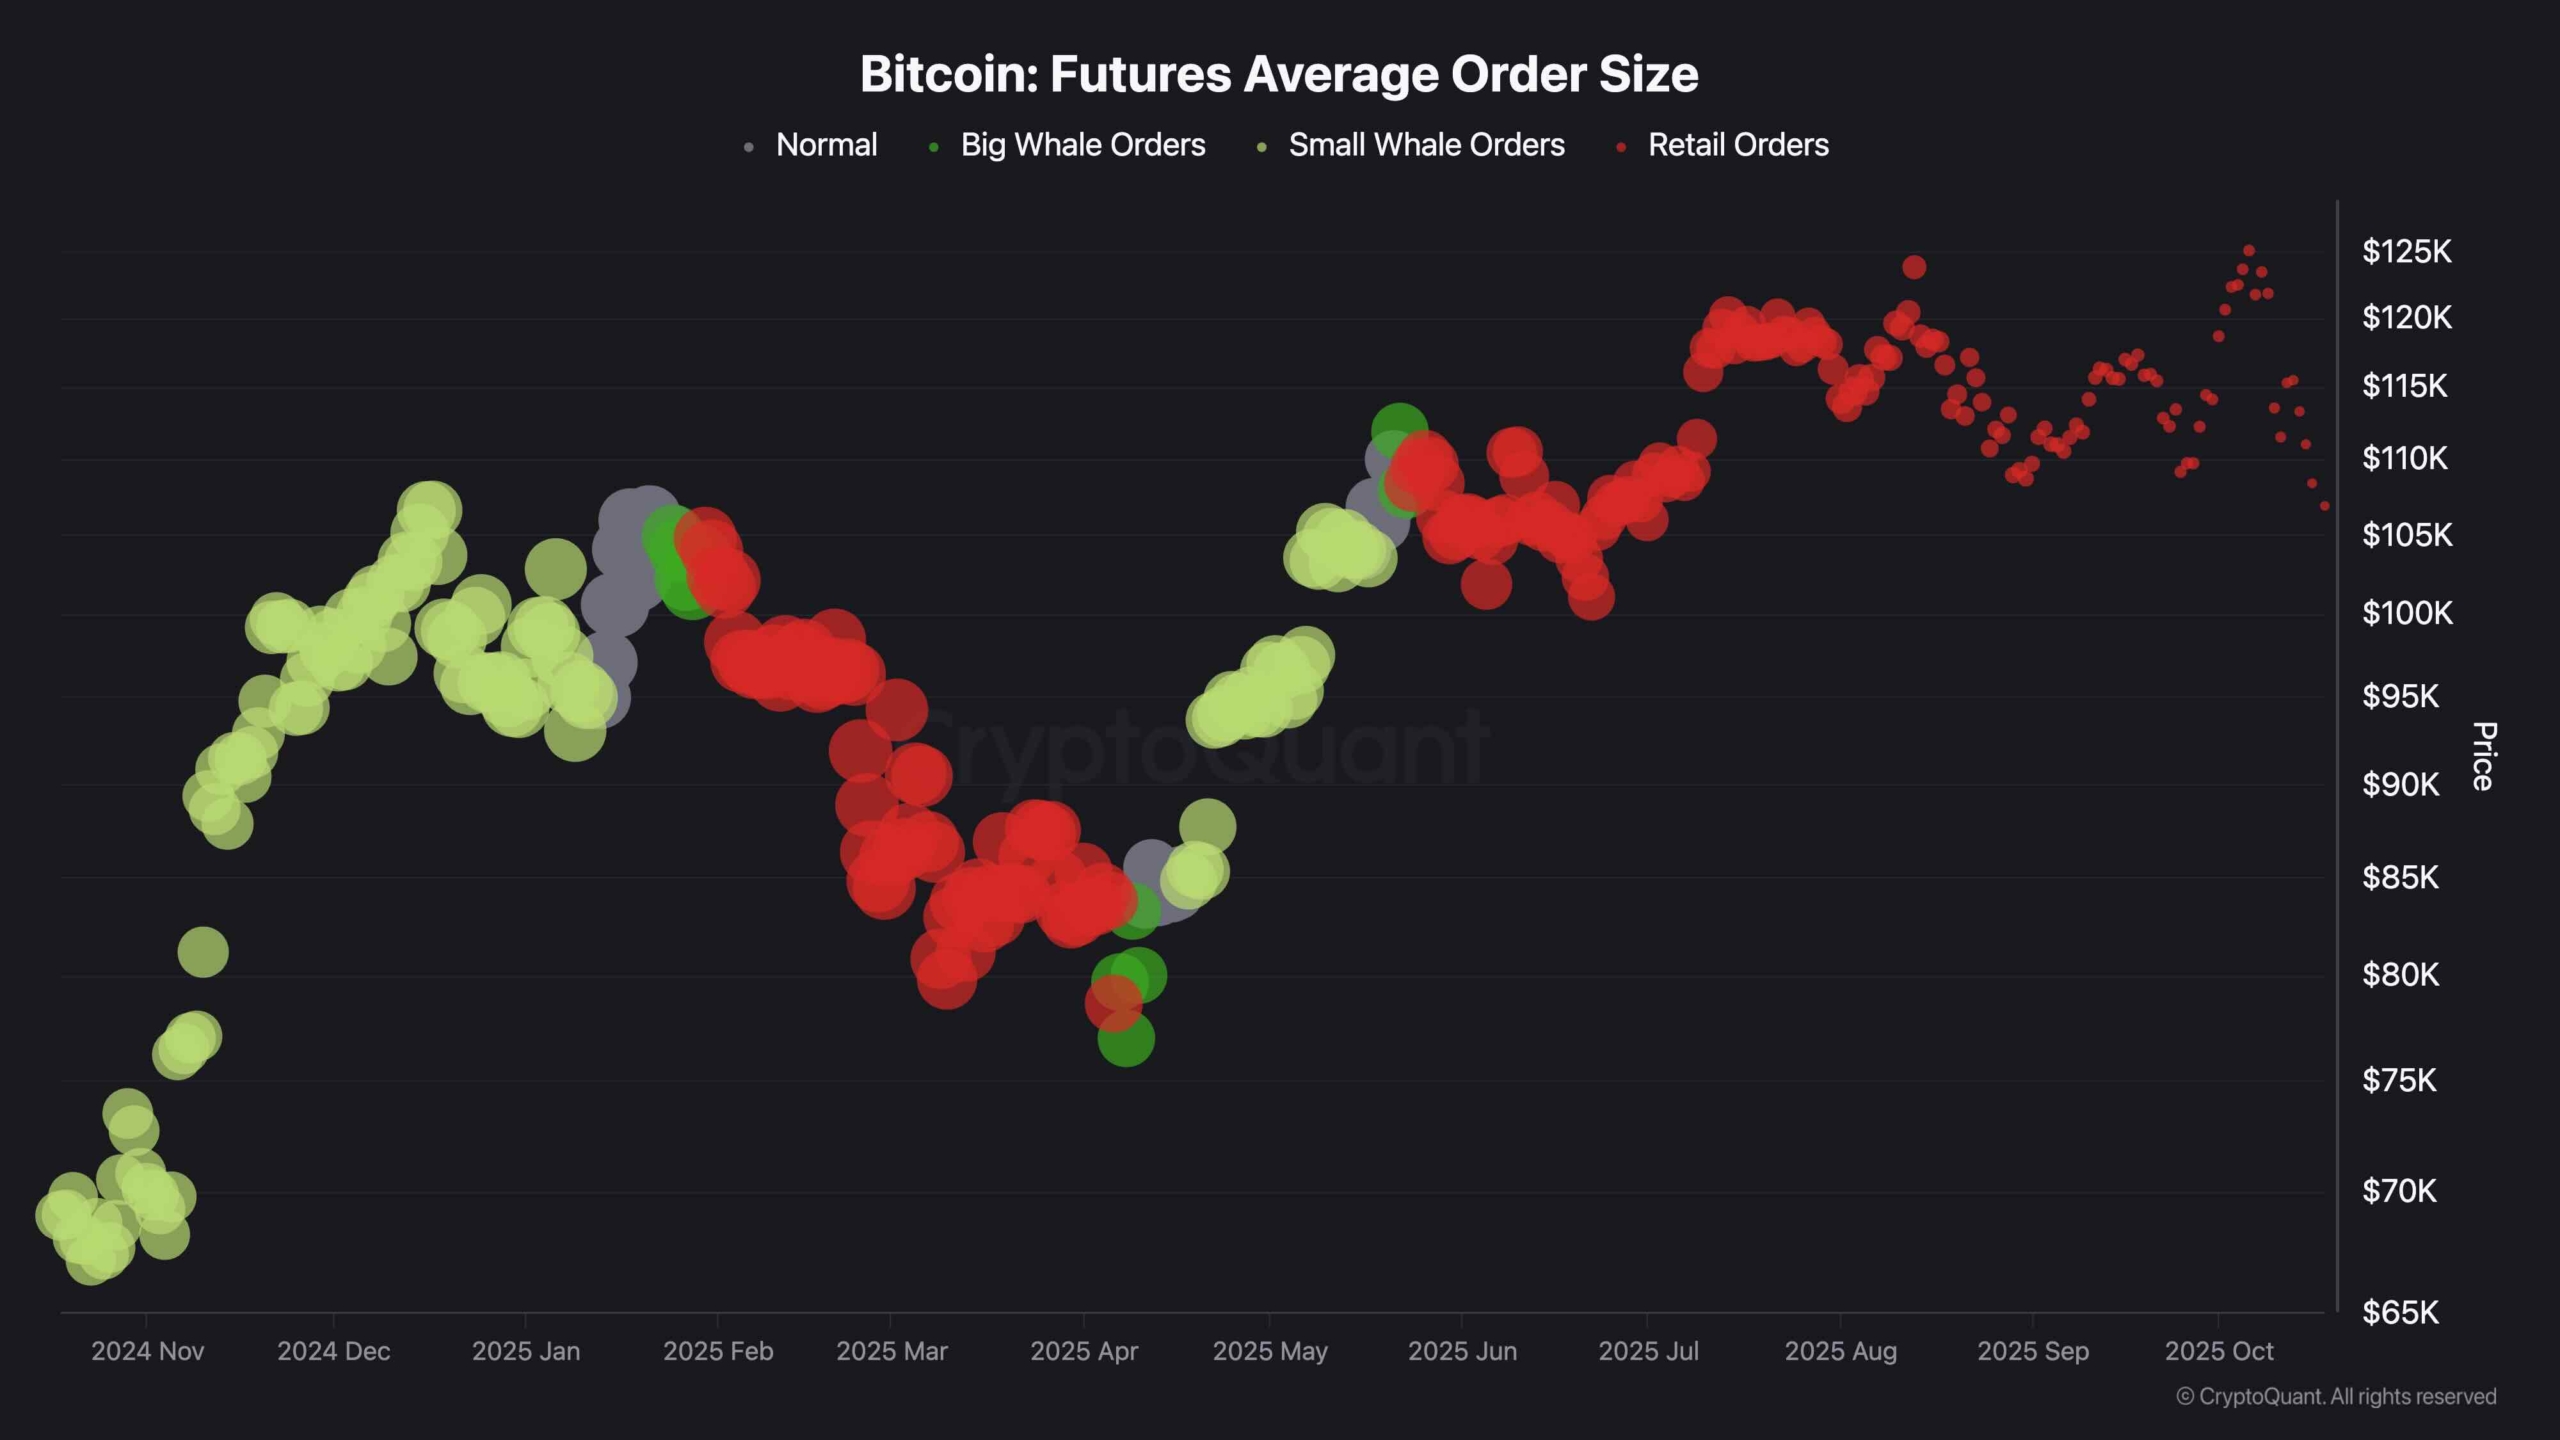
Futures Average Order Size
Futures order size data shows a dramatic shift from whale activity toward smaller, retail-driven positions over the past few weeks. As the price began correcting in September, the number of large whale orders started to vanish, replaced almost entirely by smaller retail trades.
This suggests that the smart money has stepped aside from leveraged positions, while retail traders continue to engage. This often occurs during trend exhaustion phases and the latter stages of bull markets, which is a very concerning development.
It reinforces the idea that the recent dip is not driven by strong accumulation, which increases the risk of further downside unless new institutional demand steps in.
The post Bitcoin Price Analysis: First Bearish Signs Appear as BTC Falls by $20K From ATH appeared first on CryptoPotato.
