Key Insights :
- DOGE charts suggest a 740% rally in the next bullish wave.
- Technical indicators show strong support and RSI confirmation.
- ETF approval hopes fuel further upside for Dogecoin.
Dogecoin (DOGE) price shows signs of entering a new upward cycle, supported by long-term technical formations and strong support levels. Analysts are watching key resistance levels as DOGE could see a projected 740% price rise.
These levels will determine its price trajectory in the coming months. Multiple technical indicators point to increasing momentum for Dogecoin, signaling potential bullish movement. Growing ETF optimism in 2025 may further strengthen its long-term growth trajectory.
Uptrend Structure Suggests a Major Breakout Ahead for Dogecoin
The long-term chart of DOGE displayed a logarithmic uptrend channel. A consistent pattern of higher highs and higher lows marks this channel. This indicated sustained bullish behavior.
Since early 2024, Dogecoin price has consistently followed this pattern. It has remained within the ascending structure, showing steady movement.
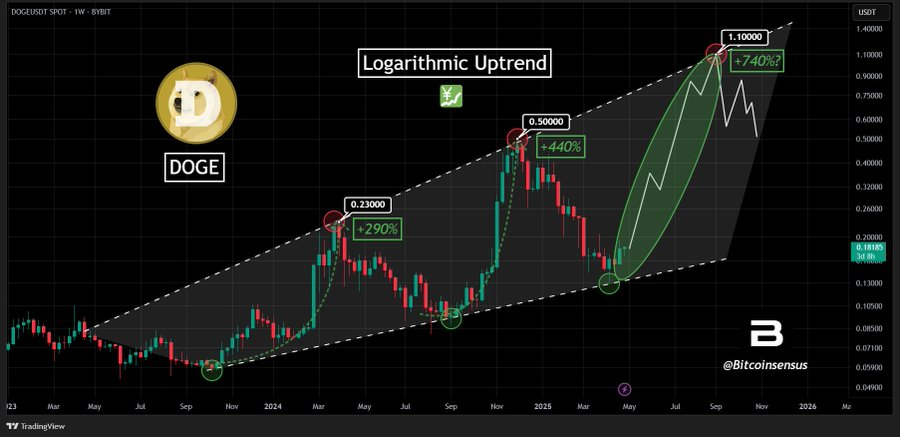
Historical wave formations on the chart suggest that DOGE has entered its third major upward cycle. The first wave moved from around $0.05 to $0.23, recording a 290% gain.
The second wave increased from $0.13 to $0.50, gaining 440%. If the pattern repeats, DOGE’s third wave could reach a projected target of $1.10, representing a potential 740% increase.
The price recently rebounded from the lower boundary of the uptrend channel. This area has historically served as a launch point for Dogecoin rallies. A breakout past intermediate resistance levels could pave the way for another significant move upward.
Technical Confirmation from Market Analysts
Several technical indicators in the market support a positive price trend. The currency has maintained a long-term rising trend line since multiple occurrences, according to TATrader_Alan.
The trendline has consistently acted as upward support, holding its position through multiple market cycles.
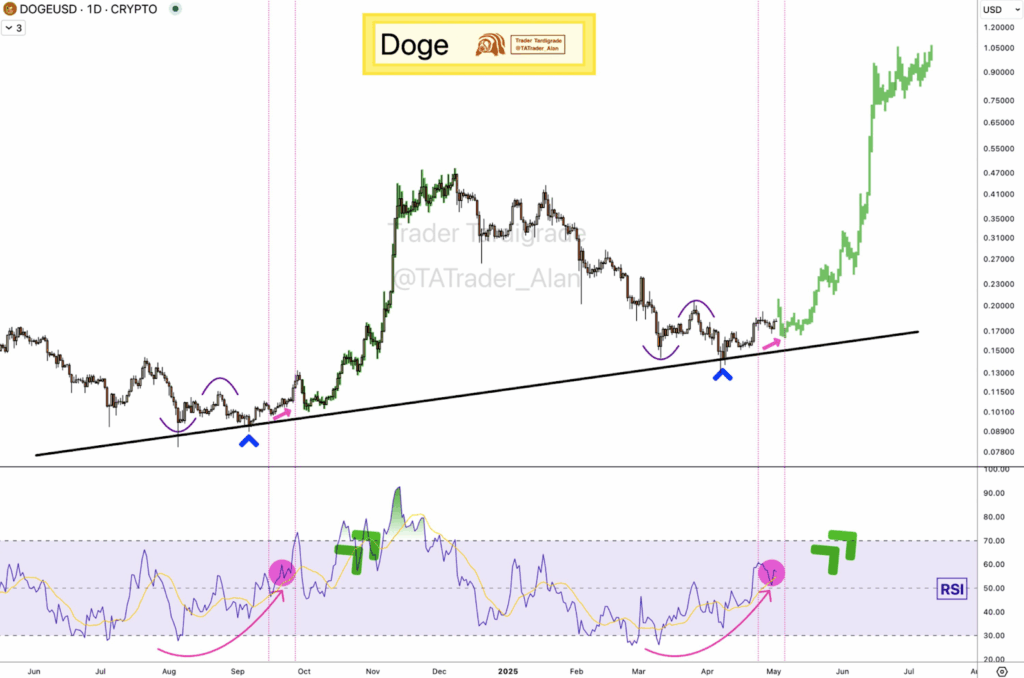
The pattern of inverse head and shoulders has emerged in the chart. This is because this formation indicates potential bullish price movements. The Relative Strength Index (RSI) shows increasing buyer strength because it has crossed above its midline.
The price experienced significant upward movements after RSI performed crossovers at this support level. The Bitgu_ru analyst detected a bullish price reversal sign in Dogecoin.
DOGE experienced its lowest point at $0.13009 back in April and went on to form a rounded bottom shape. Market accumulation tends to trigger bullish price trends, while upward price movements can frequently emerge from rounded bottom bullish curves.
The price support at $0.17500 maintains stability, yet the resistance point at $0.19270 is experiencing testing pressure.
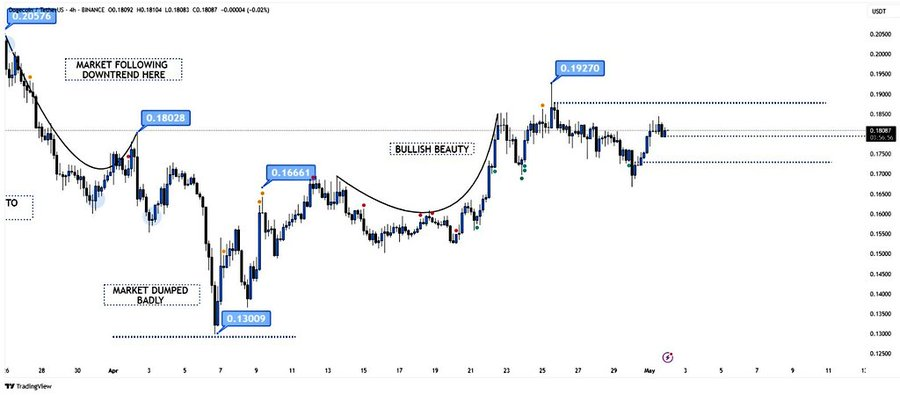
A successful breakout beyond $0.19270 would enable Dogecoin to reach the significant psychological threshold at $0.20. The analysis indicates that this price breakout will speed up bullish trends, which may activate the third price wave movement.
ETF Optimism Adds Market Support
The latest Bloomberg data highlights increasing expectations that crypto ETF approvals will happen in 2025. Research shows that DOGE exists among possible cryptocurrencies suitable for inclusion in ETF structures.
Dogecoin faces an 80% probability of launching its Exchange-Traded Fund with Litecoin at 90% and Solana at 90%. XRP holds an 85% chance, but Polkadot, Cardano, and Avalanche have a 75% forecast.
Newly approved ETFs will establish stronger standards, bringing institutions into the market. If these products get approved, shareholder interest in DOGE could see significant growth.
This expansion may surpass the retail investor enthusiasm typically seen during intense market periods.
Dogecoin Moving toward Potential Breakout
Price levels at $0.50 and $0.75 represent key following resistance zones. These levels may slow upward progress or become breakout points if buying momentum increases.
Analysts confirm that holding the price above $0.17500 creates the necessary conditions to sustain the current market structure. A sustained positive momentum could push Dogecoin toward reaching $1.10 as the primary target within its logarithmic channel pattern.
The memecoin’s next growth phase will likely be determined during the upcoming weeks. The daily chart shows DOGE breaking through a falling wedge pattern, which indicates a possible bull market change.
The RSI indicator shows 58.18, and the MFI indicator displays 61.27 values that indicate buying pressure continues to grow.
Disclaimer
In this article, the views, and opinions stated by the author, or any people named are for informational purposes only, and they don’t establish the investment, financial, or any other advice. Trading or investing in cryptocurrency assets comes with a risk of financial loss.
The post Dogecoin Eyes 740% Surge In 3rd Wave Amid Bullish Momentum appeared first on The Market Periodical.
