Key Insights:
- Chainlink price has retraced into a historical demand zone.
- Long-term holders are accumulating LINK, with significant clusters at $14.6 and $16.
- A successful $16 retest is vital for confirming bullish momentum.
Chainlink price has reentered a historical demand zone after retracing from its $25 breakout. Market data revealed that LINK maintains significant long-term support. Traders and on-chain signals indicated a possible $16 recapture in the following weeks.
Chainlink Price slips below the breakout zone—but it may be part of a retest
For most of 2024, Chainlink price consolidated inside a broad triangular structure before breaking out above $25. That breakout marked a key shift. However, the move failed to hold. LINK retraced shortly after and has now dipped back into the triangle.
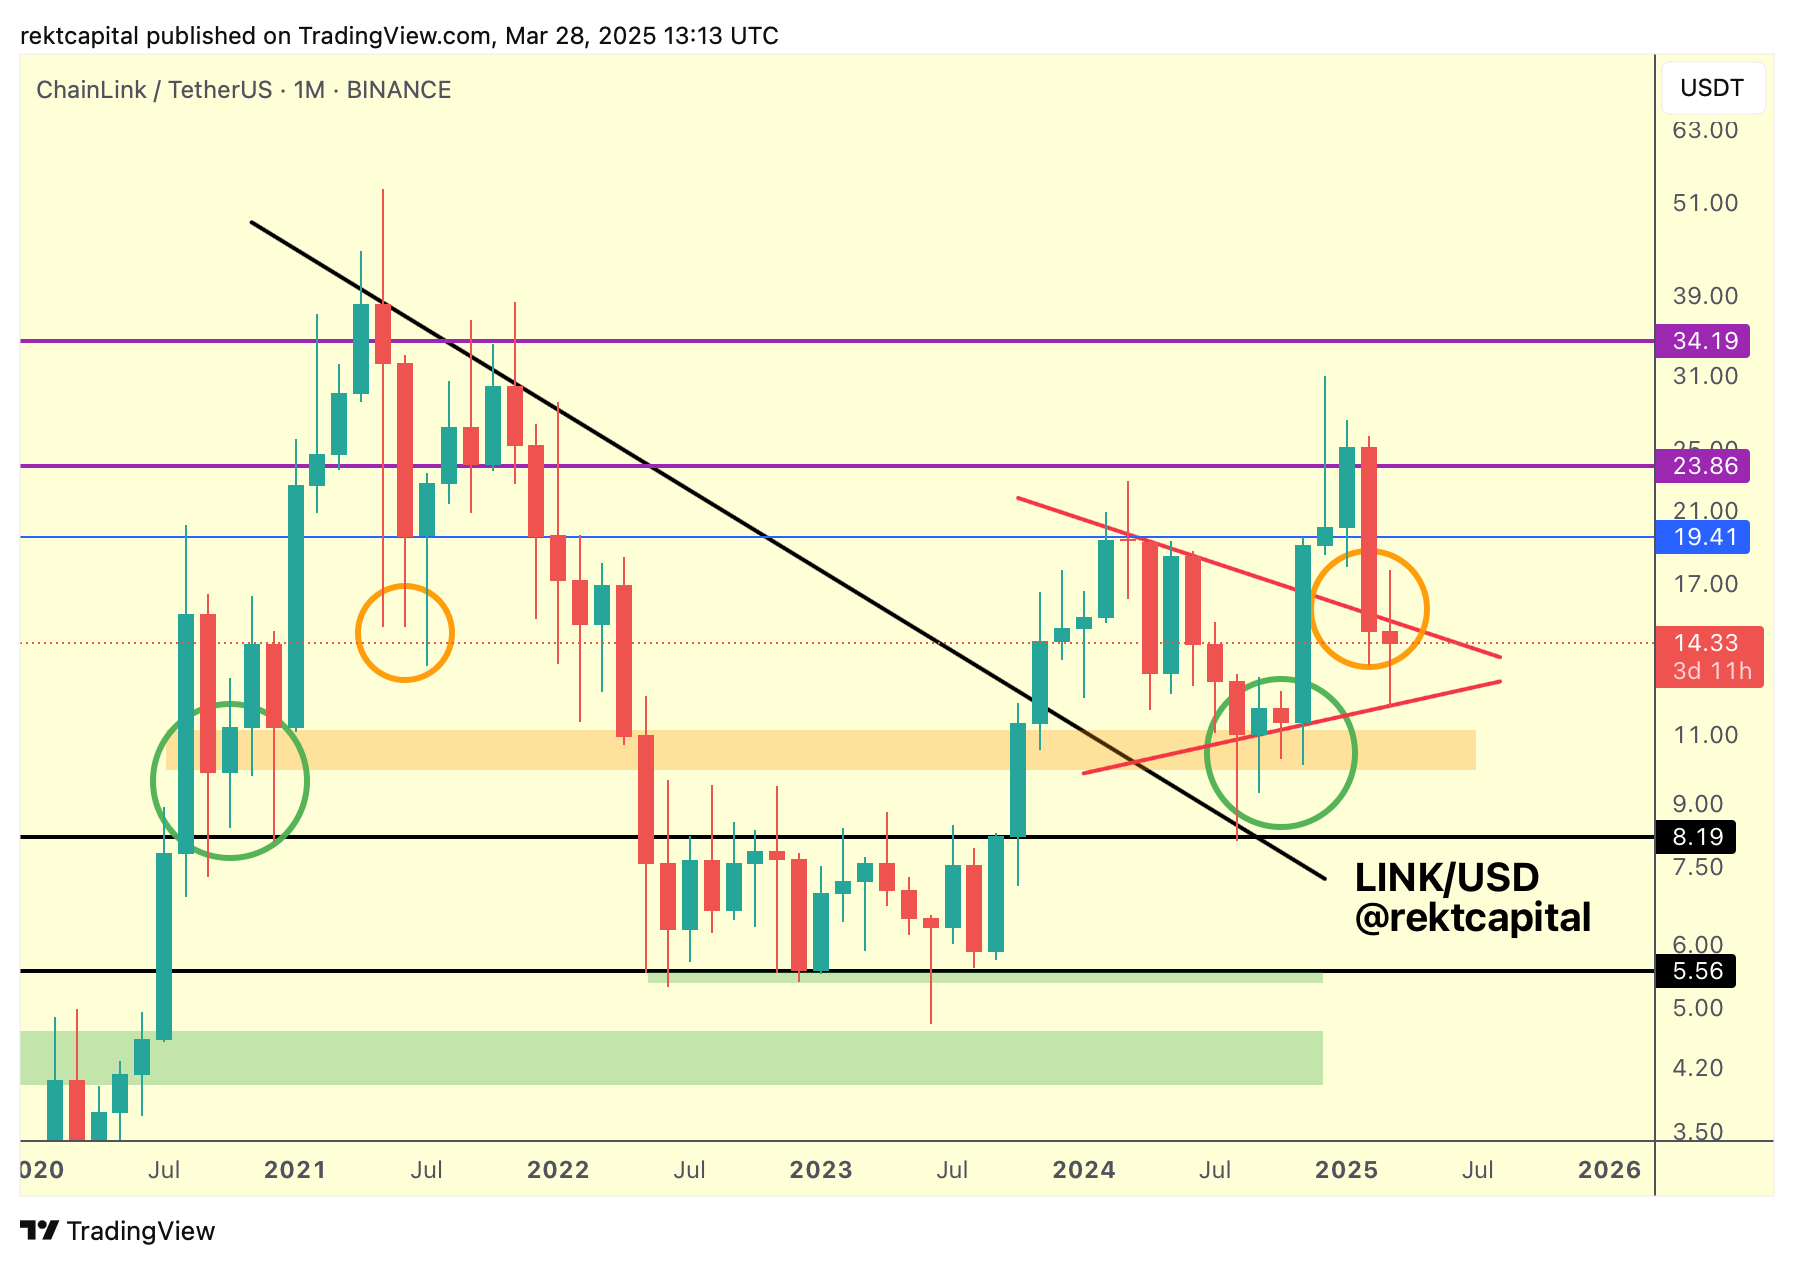
Unlike 2021’s deviation, which produced long downside wicks into the zone, LINK closed candle bodies below the pattern this time. Yet, the current setup may not mark a breakdown.
Historical price behavior around this region suggests LINK could be undergoing a volatile retest rather than invalidation.
This mirrors the trend seen in mid-2021 when LINK briefly dipped into the same zone. During that period, Chainlink price rebounded to higher levels soon after.
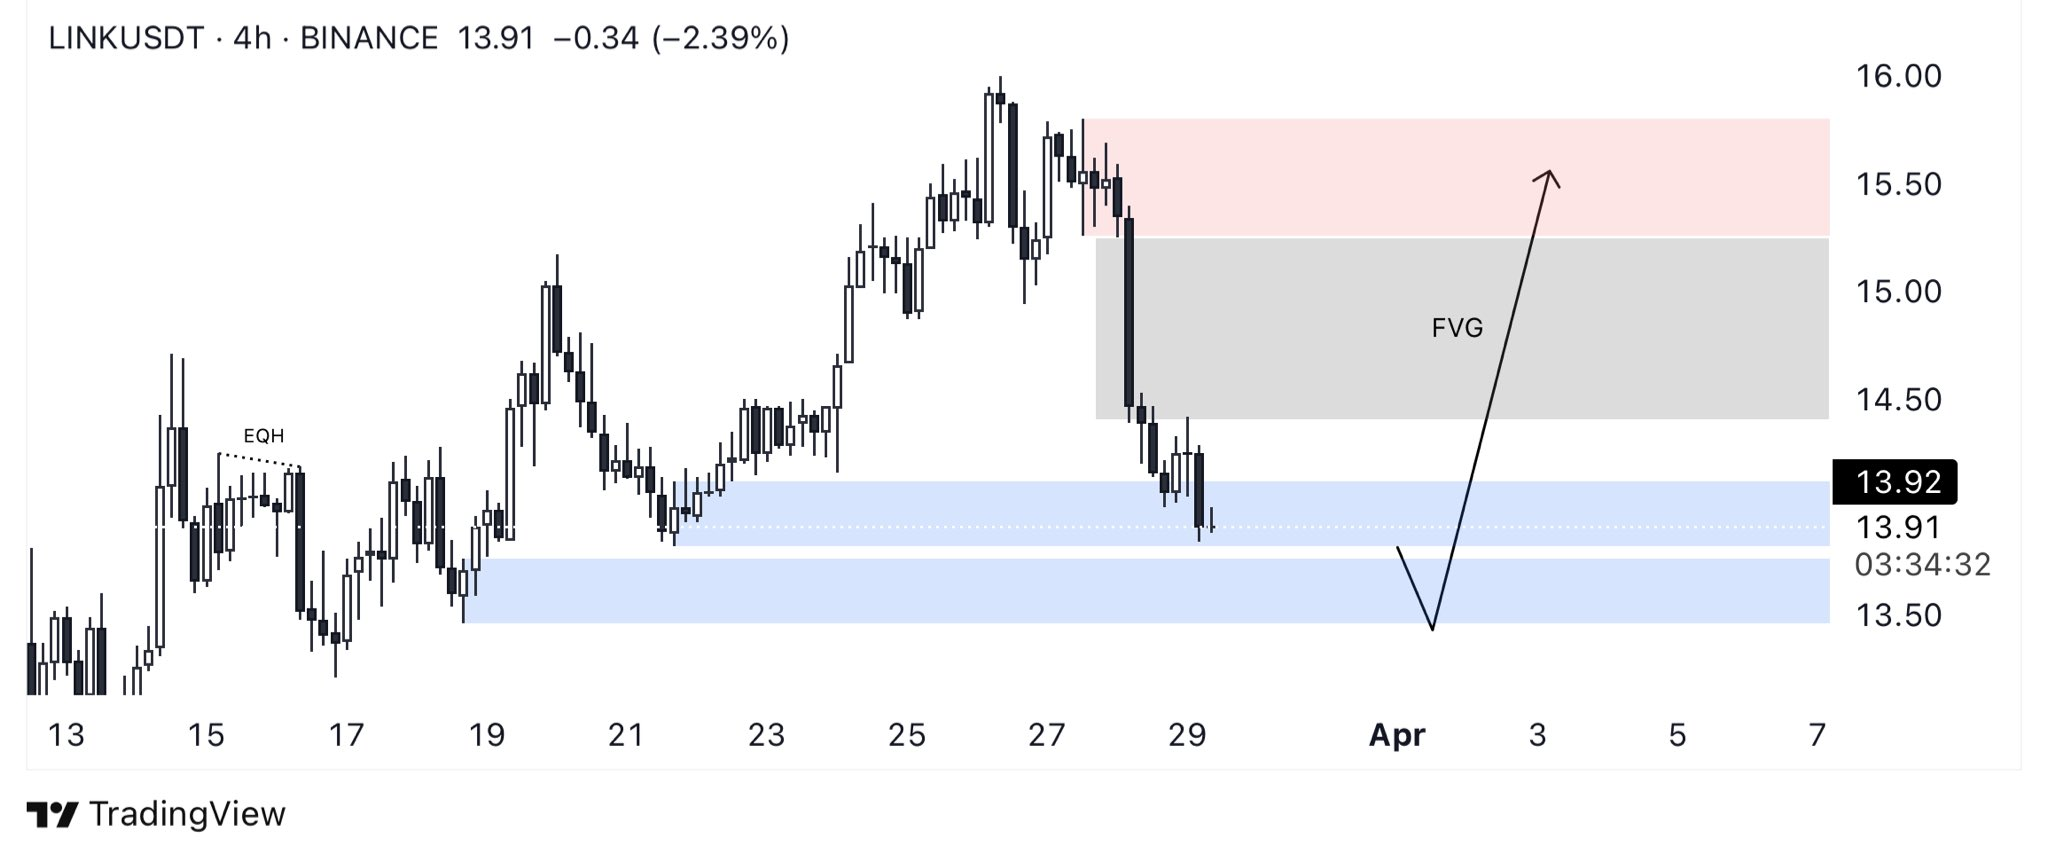
“Price swept liquidity into a key demand zone (blue) and could be gearing up for a reaction,” on-chain commentator Bullish Banter said in a March 28 post. “Eyes on the FVG fill and 15.50+ target if we get a strong push.”
Glassnode: Long-term LINK investors are still accumulating
On-chain intelligence platform Glassnode confirms strong hands are accumulating LINK in the current zone. Data from March 28 shows two major cost basis clusters centered at $14.6 and $16. Combined, these areas account for over 85 million LINK tokens.
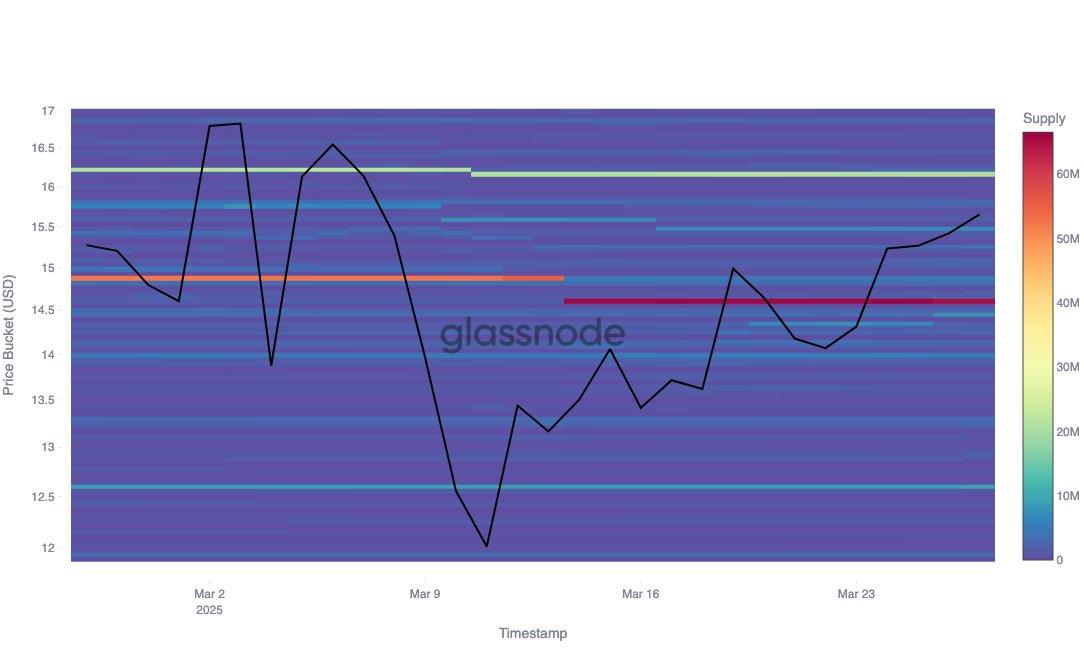
The $16 cluster shows sustained accumulation. Holders increased their tokens during December’s decline from $29 to $19 and February’s correction near $18. They added more at the March 11 low, reflecting confidence in Chainlink price recovery.
Glassnode noted that these behaviors suggest “strategic, high-conviction holders—not likely to sell into current price levels.”

The $14.6 cluster saw strategic purchases during December and January. A significant increase in buying activity followed the March 15 rebound from $12. According to Glassnode, these wallets reflect
That positioning supports the idea that LINK’s downside deviation remains within a long-term accumulation zone.
If this demand continues holding, LINK may soon retest the top of its former triangle structure. The token currently hovers around the $16 level.
$16 retest could confirm a breakout—and shift trend
Chainlink price now trades just above key historical support. Holding this zone is critical to confirming the previous breakout as valid. If bulls reclaim the $16 level, it would mark a post-breakout retest of the triangle top.

This type of deviation pattern, common in LINK’s history, has often preceded trend continuation. However, failure to hold above $14.6 would likely weaken the bullish case.
As of March 29, LINK continues to range within this green demand zone. All eyes now turn to the Monthly close. A close above the triangle top would complete the retest phase and set the stage for renewed upside.
Disclaimer
This article is for informational purposes only and provides no financial, investment, or other advice. The author or any people mentioned in this article are not responsible for any financial loss that may occur from investing in or trading. Please do your research before making any financial decisions.
The post Chainlink Bulls Eye $16 Retest After Rare Downside Deviation appeared first on The Market Periodical.
